How to debug your Delphi application code? / Debugging in delphi
Once you compile a program in Delphi and run it, you may think you’re finished, but not all of your problems may be solved. Programs can have run-time errors, or they may not work as you planned. When this happens, you will need to discover what has gone wrong and how to correct it. So Debugging is the process of finding and resolving of bugs or error in a computer software. While working with Delphi One of the things we should learn is debugging a Delphi application. Now a days every high level programming languages provides advanced debugging tools that helps to find the exact reason of the problem. Delphi also includes an integrated debugger in IDE.
In this blog I will explain some nice features in Delphi which will help you to debug your programs.
Settings required to debug codes...
Project options
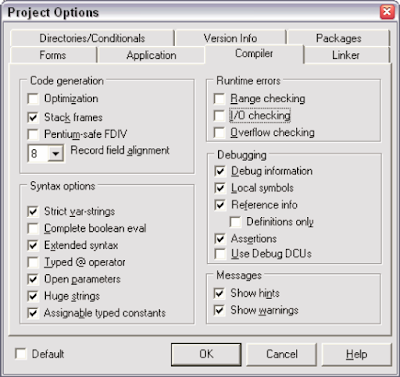
Before we start using the Delphi debugger tools, we have to make sure all necessary settings are set from Project->Options menu. After open Option dialog, do the following settings.
In old Delphi versions...
In new Delphi versions...
Without these options you will not be able to use all the debugging tools. When creating an official build of your application it is better to un-check all Debugging options and to check Optimization. Your final EXE will be a little bit smaller without this debug information.
How to debug codes?
Using of Breakpoints
Breakpoints are used to debug code lines. Generally we put a breakpoint on a source code line to trace at debug time. We can put break point by pressing the F5 button or clicking on the left bar in your code editor, it will put a red point to your source code line. When running the program, the execution will stop when it passes the source line. We can also check a breakpoints properties by Right click on breakpoint and then select Properties.
Once execution stopped at breakpoint we can use following function keys to trace codes
F7 -> Trace into to move into source lines of function/procedure
F8 -> Step over to next source line
F9 -> Run/Start to run until next breakpoint.
Debug windows
Delphi provides list of windows to check variables current values, lines details and breakpoints details during debug.
The Fly-By Debugger Hints
This Delphi feature is one of the most common ways to inspect values at run time. While a program is stopped in the debugger, you can simply move the mouse over a variable, object, property, field, or any other identifier indicating a value, and you’ll immediately get a hint window showing the current value of the identifier.
Call Stack
The Call Stack window displays the function calls in LIFO method that is the top of the Call Stack window lists the last function called by your program. Below this is the listing for the previously called function.The listing continues, with the first function called in your program located at the bottom of the list. The Call Stack window also shows the names of member functions (or methods).
Local Variables
This window will show all local variables and their current value in the current function or procedure.
Watches
During debug while tracing we can watch values of variables, expressions and object properties by using Watch window. To put a watch we can select a part of code having any expression and press CTRL+F5 or Right Click->Debug->Add watch at cursor.
Evaluate/Modify
When a program is stopped in the debugger, you can inspect the value of any identifier (variables, objects, components, properties, and so on) that’s accessible from the current execution point and can add a watch to the Watch List. We can view this dialog with CTRL+F7.
Event log
The Event log window shows all information about
• Loaded modules
• Processed breakpoints
• Breakpoint messages
• Developer messages
A Developer can add messages to Event Log window by OutputDebugString
Debug Inspector
Debug Inspector windows allow you to view data, methods, and properties of an
object or component at run time, with a user interface similar to the design-time Object Inspector. The main difference is that a Debug Inspector doesn’t show just the published properties but the entire list of properties, methods, and local data fields of the object, including private ones.


Comments
Post a Comment